CYCLIC DISTRIBUTION OF ENERGETIC X-RAY FLARES
T. LANDSCHEIDT
Schroter Institute for Research in Cycles of Solar Activity
(Received 21 February; in revised form 5 August, 1986)
Abstract. The Blackman-Tukey power spectrum of flare generated X-ray bursts > X1 observed from 1970 to 1982 by satellite instrumentation (SOLRAD/SMS/GOES) shows prominent peaks at 156, 4.8, 2.8, and 1.1 months. According to a statistical test of the significance of the deviation of these peaks from Markov red noise, the peaks at 2.8 and 1.1 months are significant at the 99% confidence level while the peak at 4.8 months reaches the 95 % level. A replication by means of the maximum entropy spectral analysis (MEM) yields the same prominent peaks at the same frequencies.
1. Flares and X-Rays
Solar flares are the most powerful and explosive of all forms of solar activity and the most important in terrestrial effect. Ultraviolet spectra taken of different flare phases revealed the existence of localized temperatures within flares that exceeded 2 x 10⁷ K (Eddy, 1979). The energy in an outstanding flare reaches 1027 J (Svestka, 1976). Skylab X-ray observations demonstrated that the energy released in the ultraviolet and X-ray wavelengths was far greater than the emission seen from the ground in visible wavelengths. Solar flares produce increases of up to three orders of magnitude in 1-8 A X-rays, and four orders in 0.5-3 A. This variability far exceeds the possible errors in flux measurement. X-rays below 10 A, emitted by energetic solar flares, are an important source of ionization in the D-region of the ionosphere, and produce Sudden Ionospheric Disturbances (SID).
2. X-Ray Classification of Flares
Flares are customarily classified by optical criteria. According to their corrected areas at the time of maximum brightness in the light of the Ha line, four importance classes are distinguished to which the subindices / = faint, n = normal, and b = brilliant are added. But the correlation of X-ray intensities with this optical flare classification is low (Kreplin etai, 1977). Even Ha subflares are found to be associated with intense X-ray events while many flares of optical importance 2 and even higher are rather insignificant on the X-ray level (Svestka, 1976). This is why Dodson and Hedeman (1971) introduced a Comprehensive Flare Index (CFI) which incorporates the importance of ionizing radiation, indicated by SID, as a weighty factor. Meanwhile, the results of direct X-ray burst measurements by means of satellites are at the disposition of scientists studying the D-region and the disturbances that are generated in that region by X-ray emitting solar flares. The SOLRAD program of the Naval Research Laboratory and the Space Environmental Monitoring System of the NOAA, the SMS (Synchronous Meteorological Satellites)/GOES (Geostationary Operational Environmental Satellites) provide accurate absolute measurements of solar X-ray flux with high time resolution. The instruments include a 0.5 to 4 A X-ray ion chamber and a 1 to 8 A chamber. The observational results are listed continually in Solar-Geophysical Data published by the National Oceanic and Atmospheric Administration (NOAA), Boulder. These data have become the basis of the X-ray classification of solar flares. This new classification is a better index of the geophysical significance of flares than the older optical groups of importance 1 to 4 (Kreplin and Walker, 1977). The new X-ray classes are based on the peak flux at 1 to 8 A of X-ray bursts produced by solar flares. The ranges of the three categories C, M, and X are: C< 10 ~2 erg cm"2 s~'; 10~2 erg cm"2 s~ ' < M< 10 x erg cm"2 s"'; X> 10" ' erg cm"2 s"'. The classes C and M comprise decadic subcategories; the X class is open beyond X9. According to SOLRAD measurements the maximum nonflare emissions are about 5 x 10"3 erg cm"2 s"1.
3. Blackman-Tukey Power Spectrum of Flare Emitted X-Ray Bursts
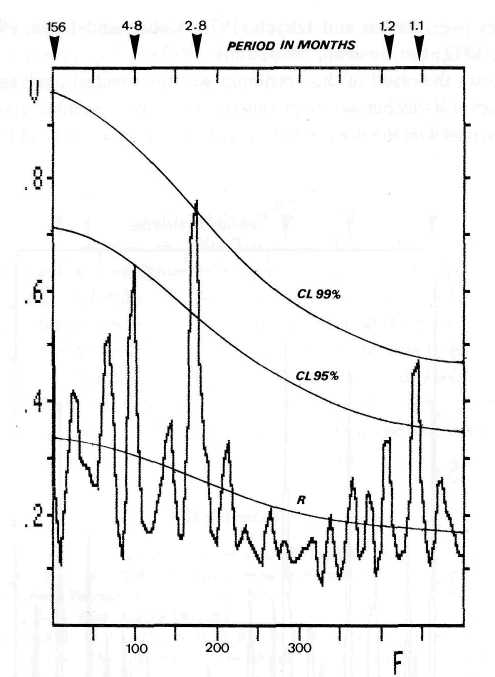
Energetic X-ray bursts below 12 A are not only correlated with SID, but also with proton flares (Svestka, 1970). They seem to be a good general indicator of the geophysical significance of flares. Thus, the soft X-ray data (1-8 A) that cover two maxima in the 11-yr sunspot cycle beg for an analysis of their distribution in time. Accordingly, all X-ray events > XI reported 1970 to 1982 in the Ursigrams of IUWDS and the prompt reports of Solar-Geophysical Data have been subjected to spectral analysis. The weighted numbers of the observed X-ray bursts were summed up within equidistant sampling intervals of half a month. The weights were derived from the X-ray class of the respective bursts. Thus, e.g., the value 9 was assigned to a sampling interval comprising one burstZ5 and two bursts X2. The resulting time series includes 312 data points. Figure 1 presents the corresponding Blackman and Tukey (1959) power spectrum. The frequency / is measured in millicycles per sampling interval of half a month. The ordinate axis designates the relative variance V of the respective frequencies. Though flares are thought to form a stochastic distribution, the spectrum shows prominent peaks at 156, 4.8, 2.8, 1.2, and 1.1 months. The amplitudes around 1.1 months are near the highest resolvable frequency, though not beyond the limit defined by the Nyquist frequency. Yet an analysis based on a sampling interval of \ month yields the same result.
There are some indications that the most pronounced peaks are real. R in Figure 1 designates the adopted Markov red noise, an appropriate model of random variability in spectra based on the Fourier cosine transform of estimates of the autocorrelation function (Mitchell, 1966). The significance of the deviation of prominent peaks from the Markov red noise level can be evaluated by means of a special #2-test (Panofsky and Brier, 1958). The resulting confidence levels CL are marked in Figure 1. The peaks at 2.8 and 1.1 months are significant at the 99% level while the peak at 4.8 months reaches the 95 % level. Two further peaks approach this zone of significance. The peak around 156 mo is at 82.5%, and the peak at 1.2 months at 90%.

Fig. 1. Blackman-Tukey power spectrum of flare-generated X-ray bursts > X1 observed 1970 to 1982 by means of satellite instrumentation. The frequency/is measured in millicycles per sampling interval of half a month. The ordinate axis represents the relative variance V of the respective frequencies. The significance of the deviation of the outstanding peaks from the Markov red noise (R) can be evaluated by means of the confidence level curves CL.
4. Maximum Entropy Spectrum of X-Ray Flares
These results are replicated by another approach. Burg (1975) has developed a new form of spectral variance analysis, the maximum entropy spectral method (MEM), which shows much higher resolution than earlier methods, especially at lower frequencies. The new method reaches an exactness and sharpness that matches the optical spectra (Bath, 1979). Meanwhile, the MEM is practised in several scientific fields including astronomy and geophysics (e.g., Jensen and Ulrych, 1973; Cohen and Lintz, 1974; Wittmann, 1978; Ulrych, 1972; Smylie etal, 1973; Junk, 1982).
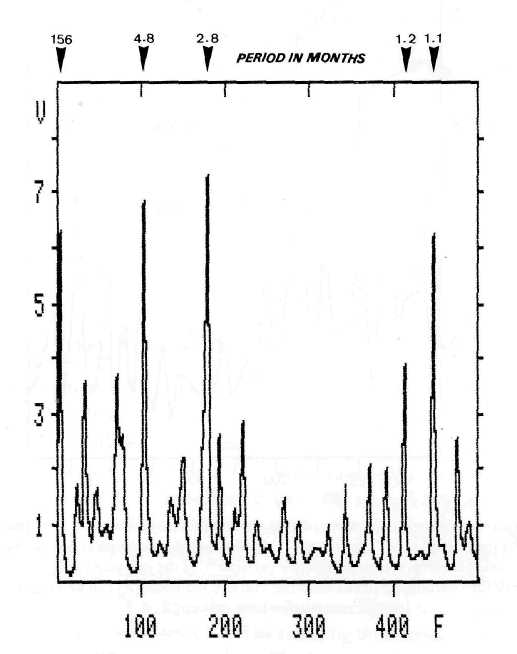
Figure 2 shows the result of the maximum entropy spectral analysis applied to the same time-series of X-ray bursts comprising the same sampling intervals of half a month. The calculation based on the Burg-algorithm covers 312 data points and 301 frequencies.

Fig. 2. Maximum entropy spectrum of the same sample of X-ray bursts > XI. The analysis based on the Burg-algorithm includes 312 data points and has a filter length of 82 coefficients. The frequency / is measured in millicycles per sampling interval of half a month. The ordinate axis indicates the relative variance of the respective frequencies. The outstanding peaks conform with those in the spectrum of Figure 1. This points to a cyclic pattern in the investigated sample of X-ray flares that covers a complete solar cycle.
The filter length of 82 coefficients is in accord with the suggestion of most authors not to go beyond 30% of the number of data points. The extreme sensitivity of the MEM can lead to spectral shifts or spectrum instability, especially when the filter length is extended beyond 30 to 40% of the length of the time-series (Junk, 1982). Experiments with different filter lengths up to 40% show that the spectrum presented in Figure 2 is stable. There is no shift in the outstanding frequencies. The MEM spectrum shows the same prominent peaks at the same frequencies as in the Blackman-Tukey power spectrum. A narrower sampling interval of \ month does not change the result.
It is a disadvantage of the MEM that an acknowledged reliability test of spectral peaks does not yet exist (Junk, 1982). According to the simple and useful 'rule of thumb' expressed by Stuart et al. (1971), a spectral peak is regarded to be significant if it contains at least three computed points which deviate from the noise and has a maximum two or three times greater than the surrounding noise level. According to this standard the peaks in Figure 2 marked by period pointers deviate significantly from the noise. As these are the same peaks as in the Blackman-Tukey spectrum of Figure 1 that proved to be significant at confidence levels going up to 99%, there is some evidence supporting their reality. A further replication is contributed by dividing the data set in half. The maximum entropy spectra for each half again set off the peaks around 4.8, 2.8, 1.2, and 1.1 months; only the 156 months period is lost, as was to be expected.
The prominent cyclic features are consistently present in all spectra examined. If further replications covering new data yield comparable results, there seem to be sufficient reasons to propose the working hypothesis that the incidence of energetic X-ray flares in the 1 to 8 A range shows a cyclic pattern.
References
Bath, M.: 1979, Spectral Analysis in Geophysics, Elsevier Scientific Publ. Co., Amsterdam, Oxford, New York.
Blackman, R. B. and Tukey, J. W.: 1959, The Measurement of Power Spectra, Dover Publ., New York.
Burg, J. P.: 1975, 'Maximum Entropy Analysis', Ph.D. Thesis, Stanford University, Palo Alto.
Cohen, T. J. and Lintz, P. R.: 1974, Nature 250, 398.
Dodson, H. W. and Hedeman, E. R.: 1971, WDC-A Report U.A.G.-14.
Eddy, J. A.: \919,A New Sun - The Solar Results from Skylab, National Aeronautics and Space Administration, Washington, D.C.
Jensen, O. G. and Ulrych, T. J.: 1973, Astron. J. 78, 1104.
Junk, H. P.: 1982, Die Maximum-Entropie-Spektral-Analyse (MESA) und ihre Anwendung auf meteorologische Zeitreihen, Diplomarbeit des meteorologischen Instituts der Universitat Bonn.
Kreplin, R. W., Dere, K. P., Horan, D. M., and Meekins, J. F.: 1977, in O. R. White (ed.), The Solar Output and its Variation, Colorado Associated University Press, Boulder, p. 287.
Mitchell, J. M.: 1966, Climatic Change, World Meteorolog. Org. Publ. No. 195, Geneva.
Panofsky, H. A. and Brier, G. W.: 1958, Some Applications of Statistics of Meteorology, The Pennsylvania State University, University Park, Pennsylvania.
Smylie, P. E., Clarke, G. K., and Ulrych, T. J.: 1973, Methods Comp. Phys. 13, 391.
Stuart, W. F., Sherwood, V., and Macintosh, S. M.: 1971, Pure Appl. Geophys. 92, 150.
Svestka, Z.: 1970, Solar Phys. 13, 471.
Svestka, Z.: 1976, Solar Flares, D. Reidel Publ. Co., Dordrecht, Holland.
Ulrych, T. J.: 1972, Nature 235, 210.
Wittmann, A.: Astron. Astrophys. 66, 93.
Solar Physics
107 (1986) 195-199. © 1986 by D. Reidel Publishing Company - T. LANDSCHEIDTPublished on http://bourabai.narod.ru/ according permission of Frau Christiane Landscheidt
|
|