Analysis of the sun's varying activity
in the last two millennia indicates that contrary to the IPCC's speculation
about man-made global warming as high as 5.8° C within the next hundred years,
a long period of cool climate with its coldest phase around 2030 is to be
expected. It is shown that minima in the 80 to 90-year Gleissberg cycle of
solar activity, coinciding with periods of cool climate on Earth, are
consistently linked to an 83-year cycle in the change of the rotary force
driving the sun's oscillatory motion about the centre of mass of the solar
system. As the future course of this cycle and its amplitudes can be computed,
it can be seen that the Gleissberg minimum around 2030 and another one around
2200 will be of the Maunder minimum type accompanied by severe cooling on
Earth. This forecast should prove skillful as other long-range forecasts of
climate phenomena, based on cycles in the sun's orbital motion, have turned
out correct as for instance the prediction of the last three El Niños years
before the respective event.
1.
Introduction
The continuing debate about man-made global warming has reached a crucial stage. The Intergovernmental Panel on Climate Change (IPCC), established by the United Nations and the World Meteorological Organisation (WMO), no longer publishes well defined “best estimate projections” of global temperature rise to the year 2100 caused by increases in greenhouse gas accumulations in the atmosphere, but publicizes “storylines” to speculate about warming as high as 5.8° C till 2100. The editors of the journal Science (2002), however, comment on the increasing number of publications that point to varying solar activity as a strong factor in climate change: “As more and more wiggles matching the waxing and waning of the sun show up in records of past climate, researchers are grudgingly taking the sun seriously as a factor in climate change. They have included solar variability in their simulations of the past century's warming. And the sun seems to have played a pivotal role in triggering droughts and cold snaps.”
Those scientists who are “grudgingly” beginning to acknowledge the sun's pivotal role in climate change are converts who had believed in the IPCC's dictum that “solar forcing is considerably smaller than the anthropogenic radiative forces” and its “level of scientific understanding is very low”, whereas forcing by well mixed greenhouse gases “continues to enjoy the highest confidence levels” as to its scientific understanding so that it is “unlikely that natural forcing can explain the warming in the latter half of the 20th century.” Actually, there had been a host of publications since the 19th century and especially in recent decades that provided evidence of strong solar-terrestrial relations in meteorology and climate ignored by proponents of man-made global warming (Koppen, 1873; Clough, 1905; Brooks; 1926; Scherhag, 1952; Bossolasco et al., 1973; Reiter, 1983; Eddy, 1976; Hoyt, 1979; Markson, 1980; Schuurmans, 1979; Landscheidt, 1981-2001; Bucha 1983; Herman and Goldberg, 1983; Neubauer 1983; Prohaska and Willett, 1983; Fairbridge and Shirley, 1987; Friis-Christensen and Lassen, 1991; Labitzke and van Loon, 1993; Haigh, 1996; Baliunas and Soon, 1995; Lassen and Friis-Christensen, 1995); Lau and Weng, 1995; Lean et al, 1995; Hoyt and Schatten, 1997; Reid, 1997; Soon et al. 1996; Svensmark and Friis-Christensen, 1997; White et al. 1997; Cliver et al., 1998; Balachandran et al., 1999; Shindell et al., 1999; van Geel et al., 1999; Berner, 2000; Egorova et al., 2000; Palle Bago and Butler, 2000; Tinsley, 2000; Hodell et al., 2001; Neff et al., 2001; Rozelot, 2001; Udelhofen and Cess, 2001; Pang and Yau, 2002; Yu, 2002)
The IPCC's judgement that the solar factor is negligible is based on satellite observations available since 1978 which show that the Sun's total irradiance, though not being constant, changes only by about 0.1 percent during the course of the 11-year sunspot cycle. This argument, however, does not take into account that the Sun's eruptional activity (energetic flares, coronal mass ejections, eruptive prominences), heavily affecting the solar wind, as well as softer solar wind contributions by coronal holes have a much stronger effect than total irradiance. The total magnetic flux leaving the Sun, dragged out by the solar wind, has risen by a factor of 2.3 since 1901 (Lockwood et al., 1999), while global temperature on earth increased by about 0.6°C. The energy in the solar flux is transferred to the near-Earth environment by magnetic reconnection and directly into the atmosphere by charged particles. Energetic flares increase the Sun's ultraviolet radiation by at least 16 percent. Ozone in the stratosphere absorbs this excess energy which causes local warming and circulation disturbances. General circulation models developed by Haigh (1996), Shindell et al. (1999), and Balachandran et al. (1999) confirm that circulation changes, initially induced in the stratosphere, can penetrate into the troposphere and influence temperature, air pressure, Hadley circulation, and storm tracks by changing the distribution of large amounts of energy already present in the atmosphere.
2. Impact of solar eruptions on weather and climate
The strongest contributors to the intensity of the solar wind are solar eruptions which create the highest velocities in the solar wind and shock waves that compress and intensify magnetic fields in the solar wind plasma. Fig. 1 after Egorova et al. (2000) demonstrates the effect of solar eruptions on temperature and atmospheric pressure. From 1981 to 1991 Egorova, Vovk, and Troshichev observed surface temperature (lower panel) and atmospheric pressure at 10 km altitude (upper panel) at the Antarctic station Vostok. Tiny open circles indicate superimposed daily observations during the winter season. The solid line describes the 10-winter average. Fat circles mark Forbush events. These are sharp decreases in the intensity of galactic cosmic rays caused by energetic solar flares which indicate that the respective event has strongly affected the earth's environment. As can be seen from Figure 1, after Forbush events temperature nearly always rose above the mean, often reaching departures around 20° C, whereas air pressure was only in 8 out of 52 cases above the mean. These 52 experiments performed by Nature and observed by man show a clear connection between solar eruptions and a strong rise in temperature, not to mention the strong decrease in air pressure. It would be a redundant exercise to assess the statistical significance of this distinct result.
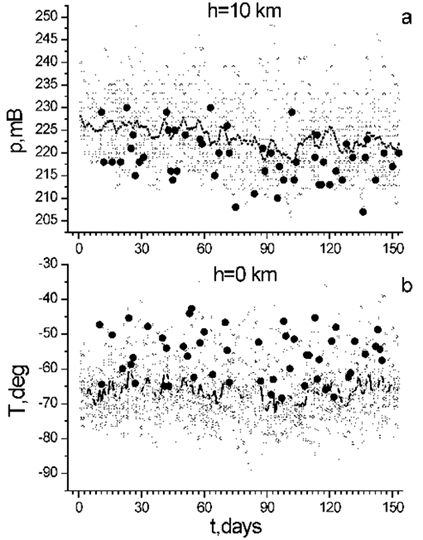
Fig. 1:
Observations of surface temperature (lower panel) and atmospheric pressure at
10 km altitude (upper panel) at the Russian Antarctic station Vostok from 1981
to 1991 (From Egorova et al., 2000). Tiny open circles indicate superimposed
daily observations during the winter season. The solid line describes the
10-winter average. Fat circles mark all Forbush events occurring within the
observation interval. These are sharp decreases in the intensity of galactic
cosmic rays caused by energetic solar eruptions. Temperature was nearly always
above the mean after Forbush events, often reaching departures around 20° C,
whereas air pressure was only in 8 out of 52 cases above the mean. The impact
of solar eruptions on air temperature and atmospheric pressure close to the
tropopause is obvious. An investigation of the statistical significance of the
relationship would be redundant.
There is cogent evidence that
the Sun's eruptional activity, too, has a strong effect in the tropics. Fig. 2
after Neff et al. (2001) shows a strong correlation between solar eruptions,
driving the solar wind, and tropical circulation and rainfall. The dark
profile represents oxygen isotope variations (ä18O) in a dated
stalagmite from Oman. The ä18O record, covering more than 3000
years (9.6 to 6.1 kyr before present), serves as a proxy for change in
tropical circulation and monsoon rainfall. The bright Ä14C profile
shows radiocarbon deviations derived from the analysis of dated tree rings.
The level of radiocarbon production in the atmosphere depends on the changing
intensity of cosmic rays. Because of the reverse relationship of cosmic rays
with solar activity – strong solar wind forms a strong magnetic shield against
cosmic rays whereas a weak solar wind shield reflects less cosmic rays - the
radiocarbon record serves as a proxy of the Sun's activity. Most scientists
think that these proxy data are related to the activity of sunspots and
faculae linked to relatively weak changes in irradiance. Actually, the
radiocarbon data are a proxy of the Sun' eruptional activity driving the solar
wind. Energetic solar eruptions do not accumulate around the sunspot maximum.
In most cycles they shun the maximum phase and can even occur close to a
sunspot minimum. The upper panel in Fig. 2 covers the whole investigated
interval, whereas the lower panel shows the nearly perfect synchronicity
between the sun's eruptional activity and tropical circulation in
detail.
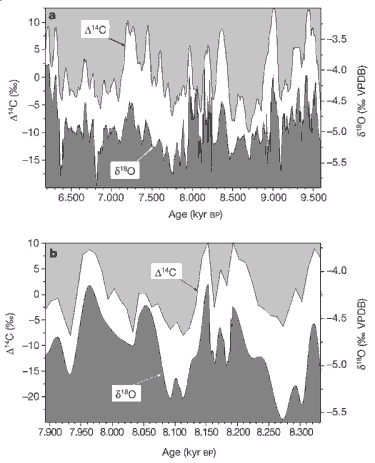
Fig. 2: Close
correlation between solar eruptions, driving the solar wind, and tropical
circulation and rainfall (From Neff et al., 2001). The dark profile represents
oxygen isotope variations (18O) in a dated stalagmite from Oman
which serve as a proxy for change in circulation and Monsoon rainfall. The
bright 14C profile shows radiocarbon deviations derived from the
analysis of dated tree rings. The level of radiocarbon production in the
atmosphere depends on the changing intensity of cosmic rays. Because of the
reverse relationship of cosmic rays with the sun's eruptional activity, the
radiocarbon record serves as a proxy for frequency and strength of solar
eruptions. The upper panel covers the whole investigated interval of more than
3000 years, while the lower panel shows the nearly perfect synchronicity
between the sun's eruptional activity and tropical circulation and rainfall in
detail.
Lake bottom cores from the Yukatan Peninsula show a
similar correlation, covering more than 2000 years, between recurrent droughts
and the radiocarbon record linked to the Sun's eruptional activity (Hodell et
al., 2001). These recent results and many earlier ones (Landscheidt,
1981-2001) document the importance of the Sun's eruptional activity for
climate.
3. Length of the 11-year
cycle and
temperature in the Nothern Hemisphere
In fact, it is quite natural to wonder whether the
sun is playing a pivotal role in changing climate because the climate on earth
owes its existence to the sun, as well as coal, oil, and energy of wind and
moving water. If the greenhouse gas carbon dioxide (CO2) were the
dominant cause of the observed rise in global temperature, the trend of this
rise would be similar to the continuously rising CO2-trend shown in
Fig. 3 after Peixoto and Oort (1992). The course of the Northern Hemisphere
land air temperature, however, represented by the thick line in Fig. 4, does
not follow the CO2-trend. The increase in surface temperature from
1890 to 1940 was steeper and smoother than in the current warming phase since
the early 1980s though the rate of anthropogenic emissions at that time was
only 10% of the present rate. From 1940 through the late 1960s temperatures
were falling in spite of the fast rise of anthropogenic
CO2-emissions.
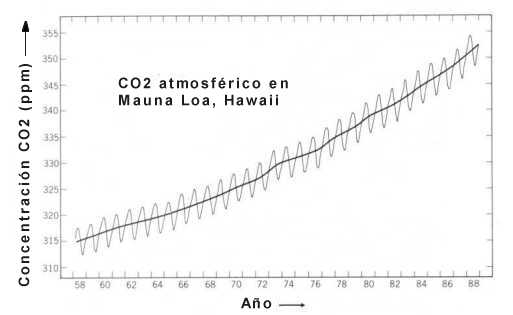
Fig. 3: Time
series of the atmospheric CO2 concentration as measured at Mauna
Loa Observatory, Hawai (From Peixoto and Oort, 1992). These data are accepted
to be representative for the global trend. Fig. 4 shows that the continually
rising CO2 – trend does not fit the up - and down course of
observed climate.
Contrary to the CO2-curve in Fig.
3, the thin curve in Fig. 4 after Friis-Christensen and Lassen (1991),
representing the smoothed length of the 11-year sunspot cycle, follows the
undulations of the observed temperature. The length of the sunspot cycle (LSC)
is an indicator of the sun's eruptional activity. When Gleissberg (1958) first
investigated LSC, he based his original LSC time series, going back to 300
A.D., on the number of observed aurorae which are known to be linked to strong
solar eruptions. He found that short cycles go along with high sunspot maxima
and strong eruptive activity, whereas long cycles are characterized by low
maxima and fewer solar eruptions. When Gleissberg smoothed his time series of
LSCs, a secular cycle of 80 to 90 years emerged which modulates the amplitudes
of the 11-year sunspot cycle. This secular cycle, called after Gleissberg, is
indicated by the thin line in Fig. 4.
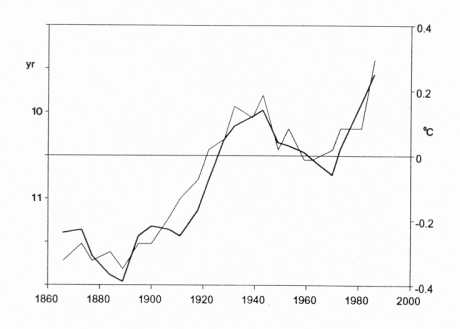
Fig. 4: Close
correlation between surface land air temperature in the Northern Hemisphere
(thick curve) and the changing length of the 11-year sunspot cycle (thin
curve), indicating the varying intensity of the sun's eruptional activity
(From Friis-Christensen and Lassen, 1991). Contrary to the curve in Fig. 3,
representing the steadily increasing amount of carbon dioxide in the
atmosphere, the thin solar curve covaries with the undulations of observed
temperature.
A closer look shows that nearly all Gleissberg
minima back to 300 A.D., as for instance around 1670 (Maunder minimum), 1810
(Dalton minimum), and 1895, coincided with cool climate in the Northern
Hemisphere, whereas Gleissberg maxima went along with warm climate as for
instance around 1130 (Medieval climate optimum). The degree of temperature
change was proportional to the respective amplitudes in the Gleissberg cycle.
During the Maunder minimum solar activity was minimal and during the Medieval
Climate Optimum very high, probably even higher than in the six decades of
intense solar activity before 1996. Accordingly, Friis-Christensen and Lassen
(1995) have shown that the connection between the Northern Hemisphere land air
temperature and varying LSC extends back to the 16th century.
Butler (1996) corroborated this result for the last two centuries in Northern
Ireland.
4. Predictable relationship
between solar eruptions and global temperature
Fig. 5 from
Adler and Elías (2000) presents an extended replication of the result in Fig.
4. LSC (filled circles), maximum ionospheric electron density in the
respective 11-year cycle (plus signs), Northern Hemisphere temperature
anomalies (empty triangles), and temperature anomalies measured in San Miguel
de Tucuman, Argentina, (empty circles) show a statistically significant
covariation. The last value in the LSC time series seems to indicate a
downward movement, a switch from short cycles to longer ones, whereas the
three other curves follow their upward trend. From this divergence, Thejll and
Lassen (2000) draw the conclusion that the impact of solar activity on
climate, prevailing for centuries, suddenly is no longer valid. Jumping to
such a conclusion is not justified. Thejll and Lassen do not take into
consideration that temperature lags solar activity by several years. This can
be seen in Fig. 5 around 1930.
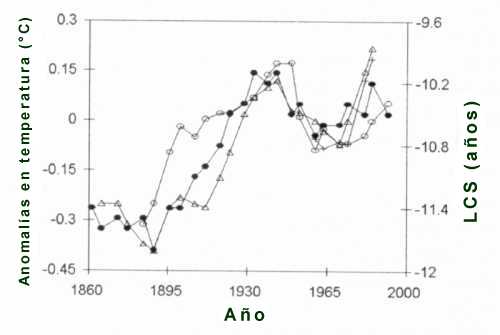
Fig. 5:
Replication of the result presented in Fig. 4 (From Adler and Elías (2000).
Length of solar Cycle SCL (filled circles), maximum ionospheric electron
density in respective 11-year sunspot cycle (plus signs), Northern Hemisphere
temperature anomalies (empty triangles), and local temperature anomalies in
San Miguel de Tucuman, Argentina (empty circles ) show a significant
covariation. As explained in the text, the downward movement at the end of the
SCL curve does not indicate that there is no longer any effect of solar
activity on climate.
LSC is a coarse indicator of the Sun's
eruptional activity. Indices of geomagnetic disturbances are finer indicators,
especially as they measure the response to those solar eruptions that actually
affect the earth. Mayaud's aa-index of geomagnetic activity is
homogeneous and covers the long period 1868 to present. Fig. 6 from
Landscheidt (2000), plotting this index, shows clearly that global land and
sea surface temperature lags geomagnetic storms, caused by energetic solar
eruptions. The solid curve shows the aa-index, the dashed curve a
combination of global land air and sea surface temperature anomalies. The
yearly data were subjected to repeated three point smoothing. Temperature lags
aa by 4 to 8 years, but follows the undulations of the aa-curve.
The connection between the leading aa-extrema and the following
temperature extrema is highlighted by identical numbers. A disturbance of the
correlation around 1940 points to exceptional internal forcing. Between 1942
and 1952 the steepest rise in volcanic activity since 1860 was observed
(Simkin et al., 1981). The lag of the temperature data suggests that some of
the excess energy linked to solar activity is stored and accumulated in the
climate system by processes taking years. Oceans are a candidate because of
their thermal inertia (Hoyt, 1979; Wigley, 1988; White et al., 1997)
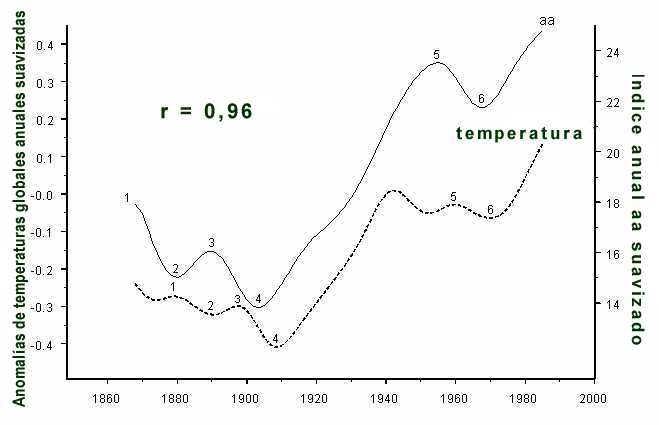
Fig. 6: The
solid curve shows the aa-index of geomagnetic activity, reflecting the
effect of energetic solar eruptions near earth. The dashed curve plots a
combination of global land air and sea surface temperature anomalies. The
yearly data were subjected to repeated three-point smoothing. Temperature lags
aa by 4 to 8 years, but follows the undulations of the aa-curve.
The connection between the leading aa-extrema and the following
temperature maxima or minima is highlighted by identical numbers. A
disturbance around 1940 points to exceptional internal
forcing.
Fig. 7 from Landscheidt (2000) is an extension of the
data in Fig. 6. It can be seen that the aa-curve reaches its highest maximum,
marked by number 7, around 1990 and shows a steep decline afterwards. Allowing
for a lag of 8 years, the highest maximum in the curve of global temperature
should have occurred around 1998. This was the year with the highest surface
temperature observed since the establishment of international meteorological
services. The relationship in Fig. 7 points to global cooling in the years
after 1998 with the exception of the period around the El Niño beginning in
2002, predicted more than 3 years before the event (Landscheidt, 1998, 2000,
2002). Revealingly, this forecast and the correct long-range prediction of the
two preceding El Niños was based on special phases of solar cycles which go
along with accumulations of solar eruptions (Landscheidt, 1995).
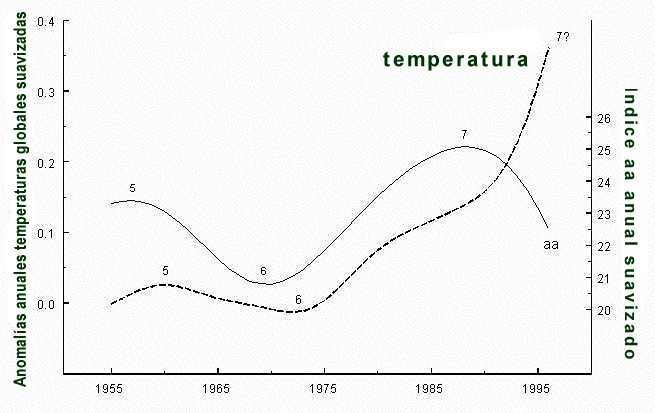
Fig. 7:
Extension of the data in Fig. 6. The aa-curve reaches its highest
maximum, marked by number 7, around 1990 and shows a steep decline afterwars.
Allowing for a lag of 8 years, a maximum in the curve of global temperature
should have occurred around 1998. This was the year with the highest
temperature observed since the establishment of international meteorological
services. This relationship points to protracted global cooling. As will be
shown, solar activity is expected to decline for three decades. This
contradicts the contention maintained by Thjell and Lassen (2000) and IPCC
supporters that the sun's impact on climate has faded away since
decades.
5. Forecast of
Gleissberg cycles based
on the sun's barycentric
oscillations
Solar variability is recorded in cores drilled
from ice sheets. The flux of cosmic rays is modulated by the solar wind, the
intensity of which is linked to solar eruptions. During periods of high
eruptional activity, the cosmic ray flux into the atmosphere is reduced so
that the production rate of radionuclides such as 14C and
10Be is diminished, and vice versa. Most radionuclides are removed
from the atmosphere by wet precipitation and quasi-permanently stored in ice
sheets, mainly in the Polar regions. Analysis of such ice core archives
reveals extended periods of exceptionally high or low solar activity which
coincide with phases of rapid climate change (Beer, 2000). The annual
10Be record “Dye 3” going back to 1423 is of special interest in
this connection as it reflects the 80 to 90-year Gleissberg cycle and its
relationship with climate (Beer et al., 1994).
Forecasts of natural
phenomena are one of the most important aims of the natural sciences. As there
are strong indications of a dependable connection between minima and maxima in
the Gleissberg cycle and cool and warm periods in climate, we are confronted
with the problem how to make long-range predictions of extrema in the
Gleissberg cycle. Knowledge of its mean length is no real help in this respect
as the cycle varies from 40 to 120 years. Fortunately, I have shown for
decades that the sun's varying activity is linked to cycles in its irregular
oscillation about the centre of mass of the solar system. As these cycles are
connected with climate phenomena and can be computed for centuries, they offer
a means to forecast consecutive minima and maxima in the Gleissberg cycle and
covarying phases of cool and warm climate.
The solar dynamo theory
developed by Babcock, the first still rudimentary theory of solar activity,
starts from the premise that the dynamics of the magnetic sunspot cycle is
driven by the sun's rotation. Yet this theory only takes into account the
sun's spin momentum, related to its rotation on its axis, but not its orbital
angular momentum linked to its very irregular oscillation about the centre of
mass of the solar system (CM). Figure 8 shows this fundamental motion,
described by Newton three centuries ago. It is regulated by the distribution
of the masses of the giant planets Jupiter, Saturn, Uranus, and Neptune in
space. The plot shows the relative ecliptic positions of the centre of mass
(small circles) and the sun's centre (cross) for the years 1945 to 1995 in a
heliocentric coordinate system.
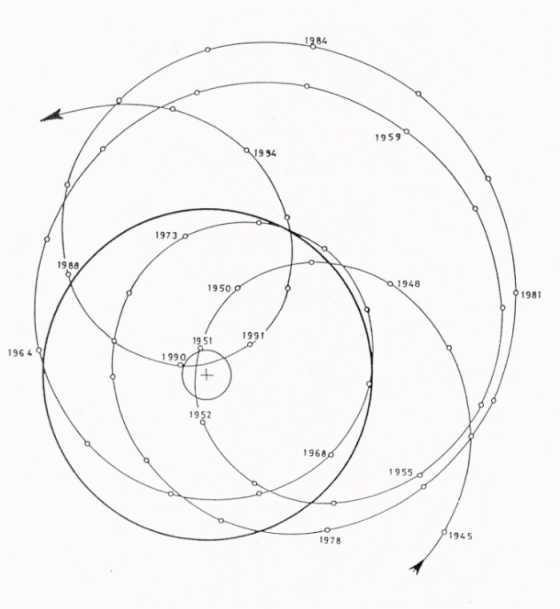
Fig. 8:
Irregular oscillation of the sun about the centre of mass of the solar system
in a heliocentric perspective. The sun's limb is marked by a thick circle. The
position of the centre of mass relative to the sun's centre (cross) in
respective years is indicated by small circles. The strong variations in the
physical quantities measuring the sun's orbital motion form cycles of
different length, but similar function in solar-terrestrial
relations.
The large solid circle marks the sun's surface. Most
of the time, the CM is to be found outside of the sun's body. Wide
oscillations with distances up to 2.2 solar radii between the two centres are
followed by narrow orbits which may result in close encounters of the centres
as in 1951 and 1990. The contribution of the sun's orbital angular momentum to
its total angular momentum is not negligible. It can reach 25 percent of the
spin momentum. The orbital angular momentum varies from -0.1·1047
to 4.3· 1047 g cm2 s-1, or reversely, which
is more than a forty-fold increase or decrease (Landscheidt, 1988). Thus it is
conceivable that these variations are related to varying phenomena in the
sun's activity, especially if it is considered that the sun's angular momentum
plays an important role in the dynamo theory of the sun's magnetic activity.
Variations of more than 7% in the sun's equatorial rotational
velocity, going along with variations in solar activity, were observed at
irregular intervals (Landscheidt, 1976, 1984). This could be explained if
there were transfer of angular momentum from the sun's orbit to the spin on
its axis. I have been proposing such spin-orbit coupling for decades
(Landscheidt, 1984, 1986). Part of the coupling could result from the sun's
motion through its own magnetic fields. As Dicke (1964) has shown, the low
corona can act as a brake on the sun's surface. The giant planets, which
regulate the sun's motion about the CM, carry more than 99 percent of the
angular momentum in the solar system, whereas the sun is confined to less than
1 percent. So there is a high potential of angular momentum that can be
transferred from the outer planets to the revolving sun and eventually to the
spinning sun.
Juckett (2000) has developed a model of spin-orbit
momentum exchange which explains well established asymmetrical phenomena in
the Northern and Southern Hemisphere of the sun and identifies changes in
solar spin radii in the different hemispheres as a mechanism of momentum
transfer. A sun-centered Coriolis acceleration could have an additional
perturbing effect on the plasma flow in the sun, especially as it develops
large discontinuities when the sun's centre comes close to the CM as in 1951
and 1990 (Blizard, 1987).
6.
Forecasts of solar activity and
climate confirm validity of solar motion
cycles
These
theoretical considerations have been corroborated by practical results.
Predictions based on cycles in the sun's motion turned out to be correct. My
long-range forecasts of precisely defined classes of energetic X-ray flares
and strong geomagnetic storms, covering the period 1979 – 1985, reached an
overall hit rate of 90 percent though such events show a very irregular
distribution. These forecasts were checked by the Space Environment Center,
Boulder, and the astronomers Gleissberg, Wöhl and Pfleiderer (Landscheidt,
1986; Landscheidt and Wöhl, 1986). Accumulations of strong geomagnetic storms
around 1982 and 1990 were also correctly forecast several years before the
events. I predicted, too, in 1984 (Landscheidt, 1986, 1987) that the sun's
activity would diminish past 1990. Just this happened. Though a panel of
experts (Joselyn, 1997) had predicted in 1996 and even two years later that
sunspot cycle 23 would have a large amplitude similar to the preceding cycles
(highest smoothed monthly sunspot number R = 160), the observed
activity was much weaker (R = 120).
My climate forecasts based
on solar motion cycles stood the test as well. I correctly forecast the end of
the Sahelian drought three years before the event, the last four extrema in
global temperature anomalies, the maximum in the Palmer drought index for
U.S.A. around 1999, extreme river Po discharges around the beginning of 2001,
and the last three El Niños as well as the course of the last La Niña
(Landscheidt, 1983-2002). This forecast skill, solely based on cycles of solar
activity, is irreconcilable with the IPCC's allegation that it is unlikely
that natural forcing can explain the warming in the latter half of the 20th
century.
7. 166-year cycle in variations
of the rotary force
driving the sun's orbital
motion
The dynamics of the sun's motion about the centre of
mass can be defined quantitatively by the change in its orbital angular
momentum L. The time rate of change in L is measured by its
first derivative dL/dt. It defines the rotary force, the torque
T driving the sun's motion about the CM. Variations in the rotary force
defined by the derivative dT/dt are a key quantity in this
connection as they make it possible to forecast Gleissberg extrema for
hundreds of years and even millennia.
A cycle of 166 years and its
second harmonic of 83 years emerge when the time rate of change in the torque
dT/dt is subjected to frequency analysis (Landscheidt, 1983).
Cycles of this length, though not well known, were mentioned in the literature
before. Brier (1979) found a period of just 83 years in the unsmoothed cosine
transform of 2148 autocorrelations of 2628 monthly sunspot numbers. Cole
(1973) confirmed this result when he investigated the power spectrum of
sunspot data covering 1626 - 1968. He found a dominant peak at 84 years.
Juckett (2000) derived periods of 165 and 84 years from his model of
spin-orbit momentum exchange in the sun's motion. As the wave length of the
Gleissberg cycle is not far from the second harmonic of the 166-year cycle, it
suggests itself to see whether the Gleissberg cycle and the
dT/dt-cycle have synchronized minima and maxima. This is
actually the case.
Gleissberg (1958) found the cycle named after him by
smoothing the length of the 11-year sunspot cycle, a parameter that is only
indirectly related to the sunspot number R measuring the intensity of
sunspot activity. As it could be that the smaller or greater values of the
positive and negative extrema of the dT/dt cycle have a similar
parametric function, the amplitudes of these maxima and minima are taken to
constitute a smoothed time series covering 2000 years. The interval is from A.
D. 300 to 2300. The data were subjected to moving window Gaussian kernel
smoothing (Lorczak) with a bandwidth of 60.
Figure 9 shows the result
for the sub period 300 - 1200. Up to the phase reversal around 1120, indicated
by an arrow, zero phases of the 166-year cycle, marked by empty circles,
coincide within a relatively narrow margin with maxima in the Gleissberg
cycle, indicated by filled triangles. Only close to the phase reversal the
deviation of the secular maximum from the zero phase is wider. The epochs of
Gleissberg minima are indicated by empty triangles. Up to the phase reversal,
they consistently go along with extrema in the 166-year cycle. It makes no
difference whether the extrema are positive or negative. This is reminiscent
of the 11-year sunspot cycle with its exclusively positive amplitudes though
the complete magnetic Hale cycle of 22 years shows positive and negative
amplitudes indicating different magnetic polarities in consecutive 11-year
cycles.
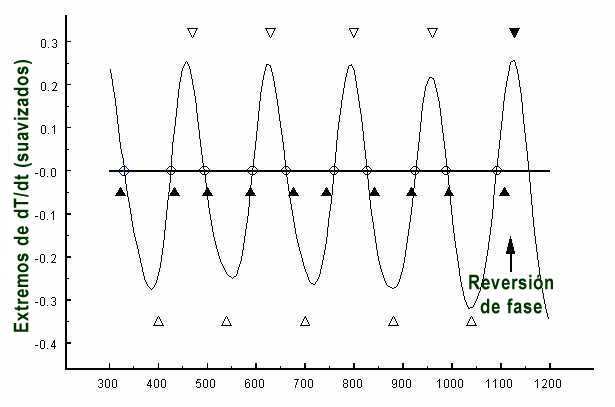
Fig. 9:
Smoothed time series (A. D. 300 – 1200) of extrema in the change of the sun's
orbital rotary force dT/dt forming a cycle with a mean length of
166 years. Up to the phase reversal around 1120, set off by an arrow, zero
phases in the cycle, marked by empty circles, coincide within a relatively
narrow margin with observed maxima in the Gleissberg cycle indicated by filled
triangles. Minima in the Gleissberg cycle, marked by empty triangles, go along
with extrema in the 166-year cycle. The phase reversal explains the
outstanding Medieval sunspot maximum. The secular maximum around 1100 was
followed by another maximum around 1130 without an intermittent minimum. As
Gleissberg maxima coincide with warm climate and minima with cool climate, the
Medieval sunspot maximum was related to exceptionally warm
climate.
The assessment of the epochs of minima and maxima by
Gleissberg (1958) is based on data of auroral activity by Schove (1955).
Hartmann (1972) has derived mean values of the epochs from data elaborated by
Gleissberg, Schove, Link, and Henkel. These dates were used in Figures 9 and
10. An analysis covering 7000 years of data confirms not only the mean cycle
length of 166 years, but also a mean interval of 83 years between consecutive
positive and negative extrema. The phase reversal by ð/2 radians around 1120
had the effect that a Gleissberg-maximum around 1100 was followed by another
maximum around 1130 without an intermittent secular minimum. This explains the
Medieval sunspot maximum indirectly confirmed by radiocarbon evidence (Siscoe,
1978).
Figure 10 shows the 166-year cycle in the period 900 - 2300.
After the phase reversal around 1120 all Gleissberg maxima, marked by filled
triangles, rather closely coincide with extrema of the curve for hundreds of
years, but around 1976 the pattern changed again because of a new phase
reversal by ð/2 radians. After a Gleissberg maximum around 1952, a second
Gleissberg maximum occurred around 1984 without an intermittent secular
minimum. Only the single 11-year sunspot cycle 20 in the middle between the
secular maxima showed lower sunspot activity, whereas cycles 18, 19, 21, and
22 reached very high levels of activity. The mean of the maxima of the five
cycles 18 - 22 is R = 156, a value not directly observed before. We
have to go back to the Medieval maximum, based on proxy data, to find a
similar pattern. The phase reversals, indicated in Figure 10 by arrows,
heuristically explain these special features occurring only twice in nearly 17
centuries. The recent Gleissberg maximum around 1984 is the first in a long
sequence of maxima connected with zero phases in the 166-year cycle, four of
which are marked by empty circles in Fig. 10. The following Gleissberg maxima
should occur around 2069, 2159, and 2235.
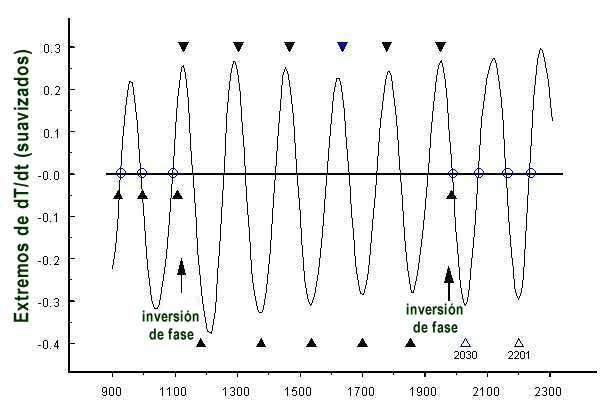
Fig. 10: Same
time series as in Fig. 9 for the years 900 – 2300. After the phase reversal
around 1120, maxima in the Gleissberg cycle, indicated by filled triangles,
consistently go along with extrema in the 166-year cycle, whereas Gleissberg
minima fall at zero phases of the cycle. Another phase reversal around 1976
changed the pattern again. After a secular sunspot maximum around 1952, a
second maximum followed around 1984 without an intermittent minimum in
between. The effect was a grand sunspot maximum comparable to the outstanding
maximum around 1120. The phase shift around 1976 reversed the pattern created
by the phase reversal around 1120. The Gleissberg maximum around 1984 is the
first in a long sequence of maxima going along with zero phases in the
166-year cycle. The following maxima should occur around 2069, 2159, and 2235.
After 1976, Gleissberg minima will again go along with extrema in the 166-year
cycle. The next secular minimum, indicated by an empty triangle, is to be
expected around 2030. The following minima should occur around 2122 and 2201.
The figure shows that the Gleissberg cycle behaves like a bistable oscillator.
The current phase should last at least through 2500. Because of the link
between Gleissberg cycle and climate, future periods of warmer or cooler
climate can be predicted for hundreds of years. The next cool phase is to be
expected around 2030.
After the phase reversal around 1976,
secular minima are expected to coincide with extrema in the 166-year cycle. So
the next Gleissberg minimum should occur around 2030, as indicated by an empty
triangle. The following minima are to be expected around 2122 and 2201. The
forecast of a secular minimum around 2030 is corroborated by a different
approach. Sýkora et al. (2000) have found that variations in the brightness of
the coronal green line are a long-range indicator of solar activity. They hold
that “we are at the eve of a deep minimum of solar activity similar to that of
the 19th century.”
8. Forecast of phase
reversals in the 166-year cycle
The presented results
indicate that the Gleissberg cycle is a bistable oscillator capable of
assuming either of two states. The transition between these states seems to be
triggered by special phases in the 166-year cycle which induce phase
reversals. It attracts attention that the phase reversals shown in Figure 10
occur just before the deepest negative extrema relative to the respective
environment. This points to quantitative thresholds which are confirmed by an
additional case. The outstanding negative extremum preceding the Medieval
maximum falls at A.D. 50. Just around this time the climax of the third grand
sunspot maximum in the past two millenia occurred as indicated by strong
14C decreases (Eddy, 1977). Revealingly, this period coincides with
the Roman climate optimum, as warm or even warmer than the Medieval optimum
(Schönwiese, 1979). There are additional arguments of a more technical nature
how to foresee phase reversals in the dT/dt–cycle (Landscheidt,
1983). All indicators show that the next phase reversal will not occur before
2500. So the current pattern should continue for hundreds of years and the
next Gleissberg minimum should be linked to the next zero phase in the
dT/dt-cycle in 2030.
9.
Forecast of deep Gleissberg minima and
cold climate around 2030 and
2200
An even more difficult question is whether future
Gleissberg minima will be of the regular type with moderately reduced solar
activity as around 1895, of the type of very weak activity like the Dalton
minimum around 1810, or of the grand minimum type with nearly extinguished
activity like the nadir of the Maunder minimum around 1670, the Spoerer
minimum around 1490, the Wolf minimum around 1320, and the Norman minimum
around 1010 (Stuiver and Quay, 1981). Fig. 11 offers a heuristic solution. It
shows the time series of unsmoothed dT/dt-extrema for the
interval 1000 – 2250. A consistent regularity attracts attention. Each time
when the amplitude of a negative extremum goes below a low threshold,
indicated by a dashed horizontal line, this coincides with a period of
exceptionally weak solar activity.
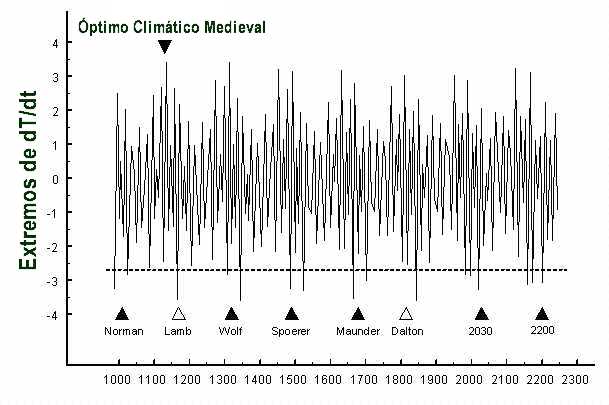
Fig. 11: Time
series of the unsmoothed extrema in the change of the sun's orbital rotary
force dT/dt for the years 1000 – 2250. Each time when the
amplitude of a negative extremum goes below a low threshold, indicated by a
dashed horizontal line, a period of exceptionally weak solar activity is
observed. Two consecutive negative extrema transgressing the threshold
indicate grand minima like the Maunder minimum (around 1670), the Spoerer
minimum (around 1490), the Wolf minimum (around 1320), and the Norman minimum
(around 1010), whereas a single extremum below the threshold goes along with
events of the Dalton minimum type (around 1810 and 1170) not as severe as
grand minima. So the Gleissberg minima around 2030 and 2200 should be of the
Maunder minimum type. As climate is closely linked to the sun's activity,
conditions around 2030 and 2200 should approach those of the nadir of the
Little Ice Age around 1670. As explained in the text, the IPCC's hypothesis of
man-made global warming is not in the way of this forecast exclusively based
on the sun's eruptional activity. Outstanding positive extrema have a similar
function as to exceptionally warm periods like the Medieval Optimum and the
modern warm period.
Two consecutive negative extrema
transgressing the threshold indicate grand minima of the Maunder minimum type,
whereas a single extremum below the threshold goes along with an event of the
Dalton minimum type. The grand minima in Fig. 11 are indicated by their names.
The single negative extremum around 1170 is of the Dalton-type. At this time
solar activity caved in, but this lull was not long-lasting. According to Lamb
(1977), who looked at the oxygen isotope record from north Greenland provided
by Dansgaard, a period of sudden cooling occurred at the end of the 12th
century. So I call this deep Gleissberg minimum after him.
Fig. 11
shows that solar activity of outstanding intensity and corresponding warm
periods on Earth, too, are indicated by the extrema of dT/dt. As
an example, the Medieval Optimum is marked by an arrow. It should be
noted that the outstanding positive amplitude around 1120 is greater than the
amplitudes around 1952 and 1984 indicating the modern Gleissberg maxima linked
to warming not as high as around 1120 (Schönwiese, 1979). More details of this
relationship will be presented elsewhere.
Without exception, the
outstanding negative extrema coincide with periods of exceptionally weak solar
activity and vice versa. So there are good reasons to expect that the coming
Gleissberg minimum around 2030 will be a deep one. As there are three
consecutive extrema below the quantitative threshold, there is a high
probability that the event will be of the Maunder minimum type. This is also
true as to the minimum around 2201, whereas the minimum around 2122 should be
of the regular type, as can be seen in Fig. 11.
It has been shown that
there is a close relationship between deep Gleissberg minima and cold climate.
So the probability is high that the outstanding Gleissberg minima around 2030
and 2201 will go along with periods of cold climate comparable to the nadir of
the Little Ice Age. As to the minimum around 2030, there are additional
indications that global cooling is to be expected instead of global warming.
The Pacific Decadal Oscillation (PDO) will show negative values up to at least
2016 (Landscheidt, 2001), and La Niñas will be more frequent and stronger than
El Niños through 2018 (Landscheidt, 2000).
The heuristic results
derived from the 166-year cycle are not yet corroborated by a detailed chain
of cause and effect. Progress in this respect will be difficult as the
theories of solar activity and climate change are still in a rudimentary stage
of development, though there is progress as to the physical explanation of
special solar-terrestrial relationships (Haigh, 1996; Tinsley and Yu,
2002).Yet the connection with solar system dynamics, the length of the
involved data series covering millennia, and the skilful forecasts of solar
activity and climate events based on the same foundation speak for the
dependability of the forecast of the coming Gleissberg minima and their
climatic impact.
10. IPCC's hypothesis
of man-made warming
not in the way of global cooling
I do
not expect that the effects of man-made greenhouse gases will eliminate the
sun's predominance. If these effects were as strong as the IPCC pretends, my
diverse climate forecasts, exclusively based on solar activity, would not have
had any chance to turn out correct. This all the more so as they cover recent
years and decades the warming of which, according to IPCC statements, cannot
be explained by natural forcing.
The IPCC's “story lines”, far from
forecasts as practised in other fields of science, are nearly exclusively
supported by runs of General Circulation Models (GCM). These models are based
on the same type of nonlinear differential equations which induced Lorenz in
1961 to acknowledge that long-range weather predictions are impossible because
of the atmosphere's extreme sensitivity to initial conditions. It is not
conceivable that the “Butterfly Effect” should disappear when the prediction
range of a few days is extended to decades and centuries.
Some
climatologists concede that there is a problem. Schönwiese (1994) remarks:
“Consequently we should conclude that climatic change cannot be predicted (by
GCMs). It is correct that the varied and complex processes in the atmosphere
cannot be predicted beyond the theoretical limit of a month via step by step
calculations in circulation models, neither today, nor in the future. Yet
there is the possibility of a conditioned forecast. The condition is that a
special factor within the complex cause and effect relationship is so strong
that it clearly dominates all other factors. In addition, the behaviour of
that single dominant causal factor must be predictable with certainty, or a
high degree of probability.” A look at the literature shows that these
conditions are not fulfilled. In addition, there are technical and
mathematical difficulties. Peixoto and Oort (1992) aptly comment: “The
integration of a fully coupled model including the atmosphere, ocean, land,
and cryosphere with very different internal time scales poses almost
insurmountable difficulties in reaching a final solution, even if all
interacting processes were completely understood.”
So it is no wonder
that validated GCM-forecasts are a rare species. The IPCC-hypothesis of global
warming requires that long-wave radiation to space is reduced because of the
accumulating anthropogenic greenhouse gases. Actually, satellites have
observed a trend of increasing tropical long-wave radiation to space over the
past two decades (Wielicki et al., 2002). GCMs predict greater increase in
temperature with increasing distance from the equator, but observations show
no net change in the polar regions in the past four decades (Comiso, 2000;
Przybylak, 2000; Venegas and Mysak, 2000). According to the most recent data,
Antarctica has cooled significantly (Doran et al., 2002) instead of warming.
Most important is a discrepancy between GMC-forecast and observation
as to evaporation. Even if the IPCC's theoretical considerations were correct,
CO2 alone could manage only about 0.8° C of warming within more than a
century. This small amount of warming, however, would increase evaporation at
the surface and raise the concentration of water vapour, by far the strongest
greenhouse gas in the atmosphere. According to the climate models, this
positive feedback would cause a much larger warming than CO2 and other weak
greenhouse gases alone. So it is crucial for the IPCC-hypothesis of global
warming that observation shows a decrease in evaporation in the Northern
hemisphere over the past 50 years instead of the predicted increase (Roderick
and Farquhar (2002). There are many other points, but they would go beyond the
frame of this paper.
11.
Outlook
We need not wait until 2030 to see whether the
forecast of the next deep Gleissberg minimum is correct. A declining trend in
solar activity and global temperature should become manifest long before the
deepest point in the development. The current 11-year sunspot cycle 23 with
its considerably weaker activity seems to be a first indication of the new
trend, especially as it was predicted on the basis of solar motion cycles two
decades ago. As to temperature, only El Niño periods should interrupt the
downward trend, but even El Niños should become less frequent and strong. The
outcome of this further long-range climate forecast solely based on solar
activity may be considered to be a touchstone of the IPCC's hypothesis of
man-made global warming.
References
Adler, N. O. de and
Elías, A. G. (2000): Solar variability associated to ionospheric,
stratospheric, and tropospheric parameters. In: Vázquez , M. and Schmieder, B,
ed.: The solar cycle and terrestrial climate. European Space Agency, Special
Publication463, 509-512.
Balachandran, N. K., Rind, D., and Shindell,
D. T. (1999): Effects of solar cycle variability on the lower stratosphere.
J. Geophys. Res. 104, 27321-27339.
Baliunas, S. und Soon, W.
(1995): Are variations in the length of the activity cycle related to changes
in brightness in solar-type stars? Astrophys. J. 450, 896.
Beer, J.
(2000): Polar ice as an archive for solar cycles and the terrestrial climate.
In: Vázquez, M. and Schmieder, B, ed.: The solar cycle and terrestrial
climate. European Space Agency, Special Publication 463, 671-680.
Beer, J.
and Joos, C. F. (1994): 10Be as an indicator of solar variability
and climate. In: E. Nesme-Ribes, ed.: The solar engine and its influence on
terrestrial atmosphere and climate. Berlin, Springer-Verlag,
221-233.
Berner, U. and Streif, H. J., ed. (2000): Klimafakten: Der
Rückblick – Ein Schlüssel für die Zukunft. Stuttgart, E. Schweizerbart'sche
Verlagsbuchhandlung.
Blizard, J. B. (1987): Long-range prediction of
solar activity. In: Rampino, M. R., Sanders, J. E., Newman, W. S. und
Königsson, L. K., eds.: Climate. History, Periodicity, and predictability. New
York, van Nostrand Reinhold, 415-420.
Bossolasco, M., Dagnino, I.,
Elena, A. und Flocchini, G. (1973): Thunderstorm activity and interplanetary
magnetic field. Riv. Italiana Geofis. 22, 293.
Brier, G. W. (1979): Use
of the difference equation methods for predicting sunspot numbers. In: B. M.
McCormac und T. A. Seliga, ed.: Solar-terrestrial influences on weather and
climate. Dordrecht, Reidel, 209-214.
Brooks, C. E. P. (1926): The
relations of solar and meteorological phenomena – A summary of the literature
from 1914 to 1924. Paris, First Report of the Commission for the Study of
Solar and Terrestrial Relationships, ICSU, 66-100.
Bucha, V. (1983):
Direct relations between solar activity and atmospheric circulation. Studia
geophysica et geodaetica 27, 19-45.
Butler, C. J. (1996): A two-century
comparison of sunspot cycle length and temperature change – the evidence from
Northern Ireland. In: ESEF The Global Warming Debate. Cambridge, European
Sciencce and Environment Forum, 215-223.
Cliver, E. W., Boriakoff, V.,
Feynman, J. (1998): Solar variability and climate change:Geomagnetic aa index
and global surface temperature. Geophys. Res. Lett. 25,
1035-1038.
Cole, T. W. (1973): Periodicities in solar activity. Solar
Phys. 30, 103-110.
Comiso, J. C. (2000): Variability and trends in
Antarctic surface temperatures from in situ and satellite infrared
measurements. J. Climate 13, 1674-1696.
Dicke, R. H.: The sun's
rotation and relativity. Nature 202 (1964), 432.
Doran, P. D., Priscu,
J. C., Lyons, W. B., Walsh, J. E., Fountain, A. G., McKnight, D. M., Moorhead,
D. L., Virginia, R. A., Wall, D. H., Clow, G. D., Fritsen, C. H., McKay, C.
P., and Parsons, A. N. (2002): Antarctic climate cooling and terrestrial
ecosystem response. Nature 415, 517-520.
Eddy, J. A. (1977): Climate
and the changing sun. Clim. Change 1, 173-190.
Egorova, L. Y., Vovk, V.
Ya., and Troshichev, O. A. (2000): Influence of variations of cosmic rays on
atmospheric pressure and temperature in the Southern pole region. J. Atmos.
Solar-Terr. Phys. 62, 955-966.
Fairbridge, R. W. and Shirley, J. H.
(1987): Prolonged minima and the 179-year cycle of the solar inertial motion.
Solar Physics 110, 191-220.
Friis-Christensen, E. and Lassen, K.
(1991): Length of the solar cycle: an indicator of solar activity closely
associated with climate. Science 254, 698-700.
Gleissberg, W. (1958):
The 80-year sunspot cycle. J. Brit. Astron. Ass. 68, 150.
Haigh, J.
D.(1996): On the impact of solar variability on climate. Nature 272,
981-984.
Hartmann, R. (1972): Vorläufige Epochen der Maxima und Minima
des 80-jährigen Sonnenfleckenzyklus. Veröff. Astr. Inst. Univ. Frankfurt 50,
118.
Herman, J. R. and Goldberg (1978): Sun, weather, and climate. New
York, Dover Publications.
Hodell, D. A., Brenner, M., Curtis, J. H.,
and Guilderson, T. (2001): Solar forcing of drought frequency in the Maya
lowlands. Science 292, 1367-1370.
Hoyt, D. V. (1979): Variations in
sunspot structure and climate. Clim. Change 2, 79-92.
Hoyt, D. V. and
Schatten, K. H. (1997): The role of the sun in climate change. New
York-Oxford, Oxford University Press, 1997.
Joselyn, J. A. (1997): EOS.
Trans. Geophys. Union 78, 210.
Juckett, D. A. (2000): Solar activity
cycles, north/south asymmetries, and differential rotation associated with
spin-orbit variations. Solar Phys. 191, 201.
Labitzke, K. und van Loon,
H. (1993): Some recent studies of probable connection between solar and
atmospheric variability. Ann. Geophysicae 11, 1084.
Lamb, H. H. (1977):
Climate: Present, past, and future. Vol. 2: Climatic history and the future.
London, Methuen, p. 430.
Landscheidt, T.(1976): Beziehungen zwischen
der Sonnenaktivität und dem Massenzentrum des Sonnensystems. Nachr. D.
Olbersgesellschaft Bremen 100, 3-19.
Landscheidt, T. (1981): Swinging
sun, 79-year cycle, and climatic change. J. interdiscipl. Cycle Res. 12,
3-19.
Landscheidt, T. (1983): Solar oscillations, sunspot cycles, and
climatic change. In: McCormac, B. M., ed.: Weather and climate responses to
solar variations. Boulder, Associated University Press,
293-308.
Landscheidt, T. (1984): Cycles of solar flares and weather.
In: Moerner, N.A. und Karlén, W., eds..: Climatic changes on a yearly to
millenial basis. Dordrecht, D. Reidel, 475, 476.
Landscheidt, T. (1986
a): Long-range forecast of energetic x-ray bursts based on cycles of flares.
In: Simon, P. A., Heckman, G., and Shea, M. A., eds.: Solar-terrestrial
predictions. Proceedings of a workshop at Meudon, 18.-22. Juni 1984. Boulder,
National Oceanic and Atmospheric Administration, 81-89.
Landscheidt, T.
(1986 b): Long-range forecast of sunspot cycles. In: Simon, P. A., Heckman, G.
and Shea, M. A., eds.: Solar-terrestrial predictions. Proceedings of a
workshop at Meudon, 18.-22. Juni 1984. Boulder, National Oceanic and
Atmospheric Administration, 48-57.
Landscheidt, T. (1987): Long-range
forecasts of solar cycles and climate change. In: Rampino, M. R., Sanders, J.
E., Newman, W. S. and Königsson, L. K., eds.: Climate. History, Periodicity,
and predictability. New York, van Nostrand Reinhold,
421-445.
Landscheidt, T. (1988): Solar rotation, impulses of the torque
in the Sun's motion, and climatic variation. Clim. Change 12,
265-295.
Landscheidt, T.(1990): Relationship between rainfall in the
northern hemisphere and impulses of the torque in the Sun's motion. In: K. H.
Schatten and A. Arking, eds.: Climate impact of solar variability. Greenbelt,
NASA, 259-266.
Landscheidt, T.(1995a): Global warming or Little Ice
Age? In: Finkl, C. W., ed.: Holocene cycles. A Jubilee volume in celebration
of the 80th birthday of Rhodes W. Fairbridge. Fort Lauderdale, The Coastal
Education and Research Foundation (CERF), 371-382.
Landscheidt, T.
(1995b): Die kosmische Funktion des Goldenen Schnitts. In: Richter, P. H.,
ed.: Sterne, Mond und Kometen. Bremen, Hauschild, 240-276.
Landscheidt,
T. (1998 a): Forecast of global temperature, El Niño, and cloud coverage by
astronomical means. In: Bate, R., ed.: Global Warming. The continuing debate.
Cambridge, The European Science and Environment Forum (ESEF),
172-183.
Landscheidt, T. (1998 b): Solar activity - A dominant factor
in climate dynamics.
http://www.john-daly.com/solar/solar.htm.
Landscheidt,
T. (1999 a): Solar activity controls El Niño and La Niña.
http://www.john-daly.com/sun-enso/sun-enso.htm
Landscheidt,
T. (1999 b): Extrema in sunspot cycle linked to Sun's motion. Solar Physics
189, 413-424.
Landscheidt, T. (2000 a): Solar forcing of El Niño and La
Niña. In: Vázquez , M. and Schmieder, B, ed.: The solar cycle and terrestrial
climate. European Space Agency, Special Publication 463,
135-140.
Landscheidt, T. (2000 b): Solar wind near Earth: Indicator of
variations in global temperature. In: Vázquez, M. and Schmieder, B, ed.: The
solar cycle and terrestrial climate. European Space Agency, Special
Publication 463, 497-500.
Landscheidt, T. (2000 c): River Po
discharges and cycles of solar activity. Hydrol. Sci. J. 45,
491-493.
Landscheidt, T. (2000 d): Sun's role in the
satellite-balloon-surface issue.
http://www.john-daly.com/solar/temps.htm.
Landscheidt,
T. (2000 e): New confirmation of strong solar forcing of climate.
http://www.john-daly.com/po.htm
Landscheidt,
T. (2001 a): Solar eruptions linked to North Atlantic Oscillation.
http://www.john-daly.com/theodor/solarnao.htm
Landscheidt,
T. (2001 b): Trends in Pacific Decadal Oscillation subjected to solar
forcing.
http://www.john-daly/theodor/pdotrend.htm
Landscheidt,
T. (2002): El Niño forecast revisited. http://www.john-daly.com/sun-enso/revisited.htm.
Landscheidt,
T. und Wöhl, H. (1986): Solares Aktivitätsminimum erst 1989/90? Sterne und
Weltraum, 584.
Lassen, K. and Friis-Christensen, E. (1995): Variability
of the solar cycle length during the past five centuries and the apparent
association with terrestrial climate. J. Atmos. Sol. Terr. Phys.,
835.
Lau, K. M. and Weng, H. (1995): Climate signal detection using
wavelet transform. Bull. Am. Meteorol. Soc. 76, 2391-2402.
Lean, J.,
Beer, J., and Bradley, R. (1995): Reconstruction of solar irradiance since
1610: implications for climate change. Geophys. Res. Lett. 22, 3195-3198.
Lockwood, R., Stamper, R., and Wild, M. N. (1999): A doubling of the
Sun's coronal magnetic field during the past 100 years. Nature 399,
437-439.
Neubauer, L. (1983): Sudden stratospheric warmings correlated
with sudden commencements and solar proton events. In: McCormac, B. M. (ed.),
Weather and Climate Responses to Solar Variations. Colorado Associated
University Press, Boulder, 395-397.
Markson, R. und Muir, M. (1980):
Solar wind control of the earth's electric field. Science 208,
979.
Neff, U., Burns, S. J., Mangini, A., Mudelsee, M., Fleitmann, D.,
and Matter, A. (2001): Strong coherence between solar variability and the
monsoon in Oman between 9 and 6 kyr ago. Nature 411, 290-293.
Pallé
Bagó, E. and Butler, C. J. (2000): The influence of cosmic rays on terrestrial
clouds and global warming. Astron. Geophys. 41, 4.18-4.22.
Pang, K. D.
and Yau, K. K. (2002): Ancient observations link changes in the sun's
brightness and erath's climate. EOS, Transactions, American Geophysical Union
83, 481, 489-490.
Peixoto, J. P. and Oort, A. H. (1992): Physics of
climate. New York, American Institute of Physics.
Prohaska, J. T.,
Willett, H. C. (1983): Dominant modes of relationships between temperature and
geomagnetic activity. In: McCormac, B. M. (ed.), Weather and Climate Responses
to Solar Variations. Colorado Associated University Press, Boulder,
489-494.
Przybylak, R. (2000): Temporal and spatial variation of
surface air temperature over the period of instrumental observations in the
Arctic. Intern. J. Climatology 20, 587-614.
Reid, G. C. (1997): Solar
forcing of global climate change since the mid-17th century. Clim. Change 37,
391-405.
Reiter, R. (1983): Modification of the stratospheric ozone
profile after acute solar events. In: McCormac, B. M., ed.: Weather and
climate responses to solar variations. Boulder, Associated University Press,
95-116.
Roderick, M.L. and Farquhar, G. D. (2002): The cause of
decreased pan evaporation over the past 50 years. Science 298,
1410.
Rozelot, J. P. (2001): Possible links between the solar radius
variations and the Earth's climate evolution over the past four centuries. J.
Atmos. Sol. Terr. Phys. 63, 375-386.
Scherhag, R., 1952: Die
explosionsartigen Stratosphärenerwärmungen des Spätwinters 1951/52. Berichte
des Deutschen Wetterdienstes der US-Zone Nr. 38,51.
Schönwiese, C. D.
(1979): Klimaschwankungen. Berlin, Springer-Verlag, p. 79.
Schönwiese,
C. D. (1994): Klima im Wandel. Hamburg, Rowohlt Taschenbuch Verlag,
p.99.
Schove, J. D. (1955): The sunspot cycle 649 BC to AD 2000. J.
Geophys. Res. 60, 127.
Schuurmans, C. J. E (1979).: Effects of solar
flares on the atmospheric circulation. In: B. M. McCormac und T. A. Seliga,
ed.: Solar-terrestrial influences on weather and climate. Dordrecht, Reidel,
105.
Science editor's comment, 2002: Areas to watch in 2003. Science
298, 2298.
Shindell, D., Rind, D., Balachandran, N., Lean, J., and
Lonergan, P. (1999). Solar cycle variability, ozone, and climate. Science 284,
305-309.
Simkin, T., Siebert., L., McClelland, L. Bridge, D., Newhall,
C., and Latter, J. H. (1981): Volcanoes of the world. Stroudsburg, Hutchinson
Ross.
Siscoe, G. L. (1978): Solar-terrestrial influences on weather and
climate. Nature 276, 348-351.
Soon, W. H., Posmentier, E. S., and
Baliunas, S. L. (1996): Inference of solar irradiance variability from
terrestrial temperature changes, 1880-1993. Astrophys. J. 472,
891-902.
Stuiver, M. and Quay, P. D. (1981): a 1600-year long record of
solar change derived from 14C levels. Solar Phys. 74,
479-481.
Svensmark, H. and Friis-Christensen, E. (1997): Variation of
cosmic ray flux and cloud coverage. J. Atmos. Terr. Phys.
59,1225-1232.
Sýkora, J., Badalyan, O. G., and Obridko, V. N. (2000):
Coronal holes, recorded from 1943 – A source of solar-induced terrestrial
responses? In: Vázquez, M. and Schmieder, B, ed.: The solar cycle and
terrestrial climate. European Space Agency, Special Publication 463,
95-100.
Thejll, P. and Lassen, K. (2000): Solar Forcing of the Northern
Hemisphere land air temperature: New data. J. Atm. Sol. Terr. Phys. 62,
1207-1213.
Tinsley, B. A. (2000): Influence of the solar wind on the
global electric circuit, and inferred effects on cloud microphysics,
temperature, and the dynamics of the troposphere. Space Sci. Rev. 94,
231-258.
Tinsley, B. A. and Yu, F. (2002):Atmospheric ionisation and
clouds as links between solar activity and climate. In: AGU-monograph: Solar
variability and its effects on the earth's atmosphere and climate system. In
press.
Udelhofen, P. M. and Cess, R. (2001): Cloud cover variations
over the United States: An influence of cosmic rays, or solar variability?
Geophys. Res. Lett. 28, 2617-2620.
Van Geel, B., Raspopov, O. M.,
Rennsen, H., van der Pflicht, J., Dergachev, V. A., and Meijer, H. A. J.
(1999): The role of solar forcing upon climate change. Quaternary Science Rev.
18, 331-338.
Venegas, S. A. and Mysak, L. A. (2000): Is there a
dominant timescale of natural climate variability in the Arctic? J. Climate
13, 3412-3434.
White, W. B., Lean, J., Cayan, D. R., and Dettinger, M.
D. (1997): Response of global upper ocean temperature to changing solar
irradiance. J. Geophys. Res. 102, 3255-3266.
Wielicki, B. A., Wong, T.,
Allan, R. P., Slingo, A., Kiehl, J. T., Soden, B. J., Gordon, C. T., Miller,
A. J., Yang, S. K., Randall, D. A., Robertson, F., Susskind, J., and
Jacobowitz, H. (2002): Evidence of large decadal variability in the tropical
mean radiative energy budget. Science 295, 841-844.
Wigley, T. M. L.
(1988): The climate of the past 10,000 years and the role of the sun.
In:Stephenson, F. R., Wolfendale, A. W. (eds.), Secular Solar and Geomagnetic
Variations in the Last 10,000 Years. Kluwer, Dordrecht.
Yu, F. (2002):
Altitude variations of cosmic ray induced production of aerosols: Implications
for global cloudiness and climate. Geophys. Res. Lett. 107, in
press.
Source: http://mitosyfraudes.8k.com/
|
|
